How to Use Debug Tools in UniFi Controller
Discover UniFi's 'Debug Tools' setting and what it does. This article walks you through enabling direct SSH-like terminal access to your UniFi switches and access points for quick diagnostics.


Have you ever wondered about those 'Debug Tools' you can enable in your UniFi settings? In this article, we'll explain exactly what they are, where to find them, and how you can leverage them for direct troubleshooting and management of your UniFi devices.
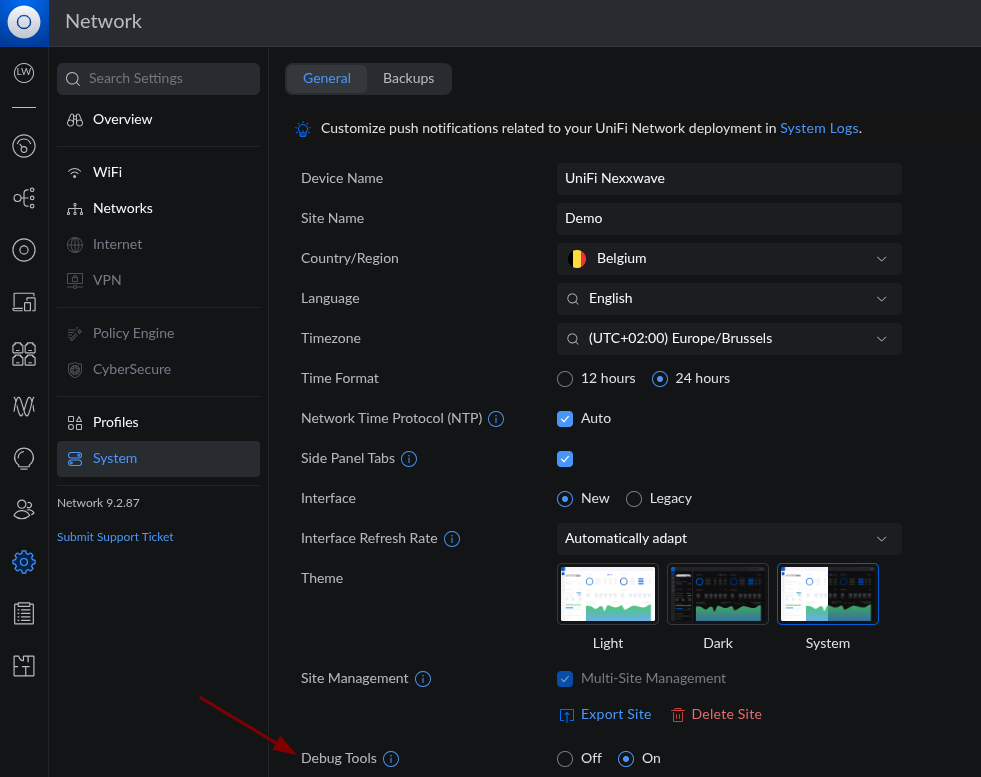
Locating the Debug Tools Setting
You'll find the option to enable Debug Tools within your UniFi Controller settings. Navigate to Settings > System > General. Here, you can toggle the 'Debug Tools' option On or Off.
Accessing the Device Terminal
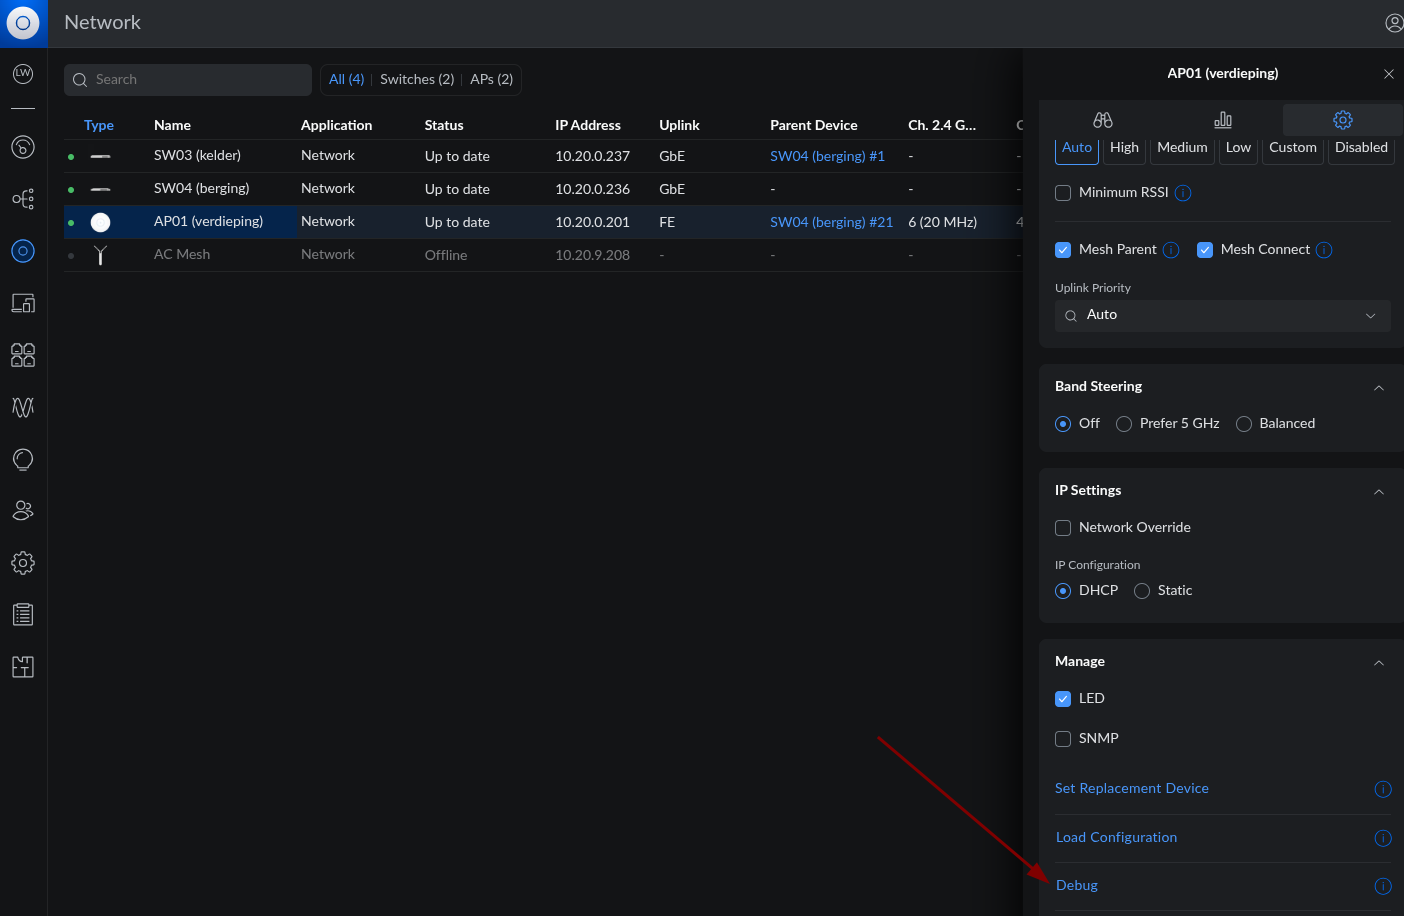
Once you've enabled Debug Tools, a new 'Debug' option will appear within the settings panel of each individual UniFi device (e.g., a UniFi Switch or Access Point).
Clicking on this 'Debug' option will open a terminal window directly connected to that specific UniFi device.
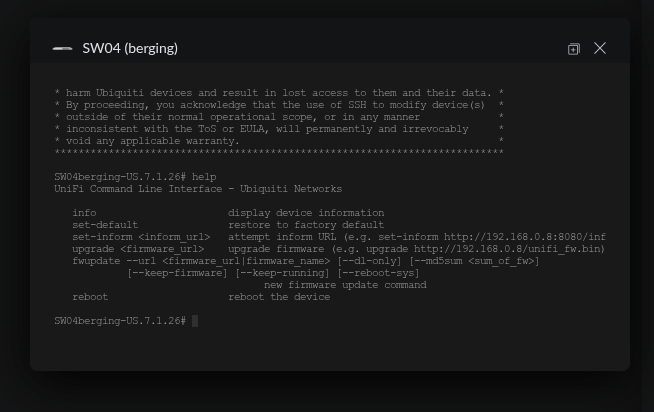
Working with the Device Command Line
As soon as the connection is established, you'll be logged into the command line interface (CLI) of your UniFi device. This gives you powerful, direct control.
- To get an overview of all available commands, simply type
helpand press Enter. - For example, you can use the
infocommand to display detailed information about the device, or therestartcommand to quickly reboot the device.